Exploratory Analysis of CIA Factbook Data Using Kohonen Self-Organizing Maps
Abstract
A visual country comparison is of great importance to research and practice. The method of Kohonen Self-Organizing Maps (SOM) is able to present the data in a visual map and at the same time tries to maintain the topological features of the data. We employ SOM and use data from the 2007 Central Intelligence Agency (CIA) World Factbook to identify what patterns exist between selected countries and their people, economies, communications, and defense forces. Examining 22 indicator variables on 190 countries, we generate a SOM as a means to better understand plausible groupings between countries of the world. The SOM allows us to see a clear visualization of country characteristics by producing multicolored two dimensional hexagonal lattices. In the analysis of these lattices, we identify a tendency for countries to cluster around their particular geographical location – and find that each of these identified clusters has pronounced characteristics associated with each. Extensions of this work over several years may help those interested in world demographics to see the shift in countries over time. This article is accessible to readers with an intermediate level of statistics.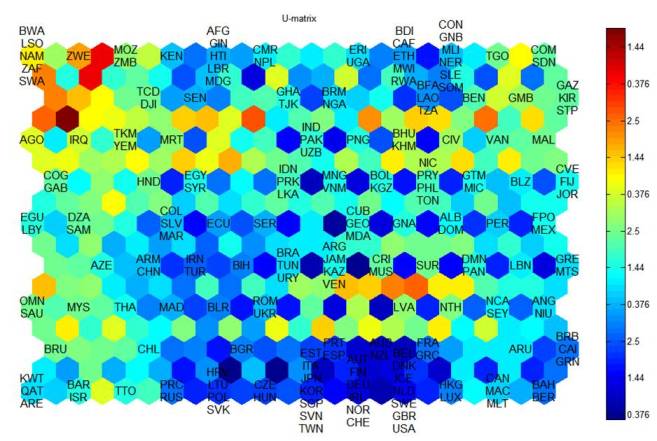
Downloads
Additional Files
Published
2014-08-25
Issue
Section
Articles
